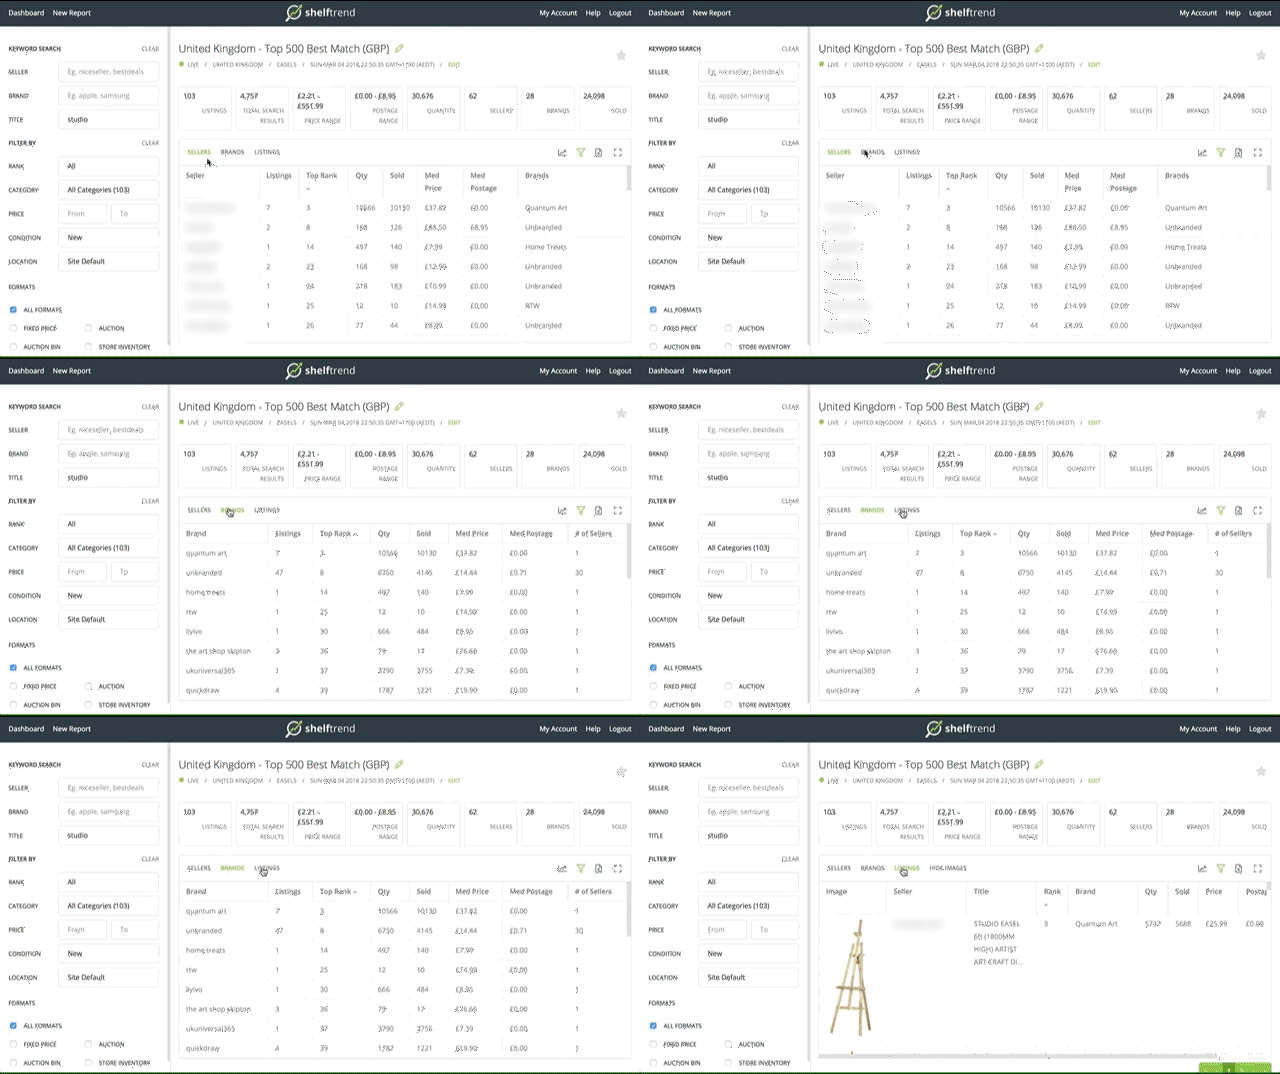
Data View: Sellers
In Seller view, the table has data aggregated by Seller ID. Click the Seller ID to deep dive into the seller’s listings.
Questions to ask yourself in the Seller view:
Is there a dominant seller? - Click on Seller ID to drill into the listings.
What are the Prices and Postage being charged?
Where the items are located?
What types of Brands have sellers sourced? Are they unbranded, private label brands or popular brands?
How serious is the competitor – what is their stock level and how aggressively are they pricing?
Data View: Brands
In Brand view, the table shows data aggregated by Brand. Click on a brand to deep dive into its listings.
Questions to ask yourself in the Brand view:
How much stock is being supplied by brand?
Does anyone have access to a unique product that has found a loyal following?
Check out chainsaw brands on eBay Australia for a great example of this in real life!
Data View: Listings
In the Listing view, the table displays all listings within the data set and associated metrics.
Questions to ask yourself in the Listings view:
Sort by quantity sold and check listings that have sold the most stock. What are the best practices that are being used?
Images, Title, Item Specifics, Product Identifiers, Description
Seller customer service (Postage, handling, and returns
Prices and promotion strategies effecting sales.
Can you improve on the current offering?


