
The New Listings report offers a summary of new or re-listed eBay listings up to the last 7 days. This report offers insight into the new products and brands coming onto the marketplace and early warning of a flood of new inventory that could threaten your price point and sales. Run the report for your competitor to assess their latest inventory investment or uncover their category expansion plans.
Below is a walk through and glossary of the main components of the New Listings report.
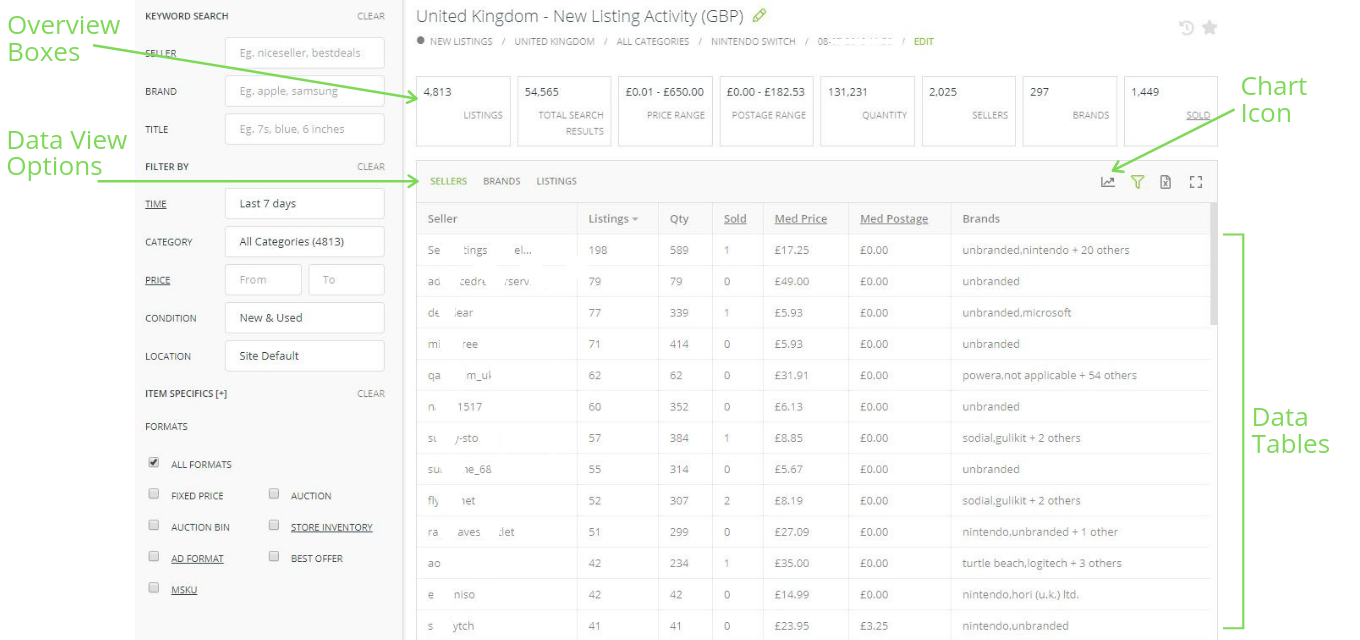
Overview Boxes
Overview boxes summarise the data set. The definitions of each metric are:
Listings: A count of listings in the data set. Report summaries and calculations are based on those listings.
Total Search Results: The total number of search results returned for your search, of which in the New Listings Report only includes the newest of those listings up to the past 1 week.
Price Range: The range of prices being offered.
Postage Range: The range of Postage/Shipping costs being offered.
Quantity: Inventory stock levels currently available.
Sellers: Number of sellers where new listings have come from
Brands: Number of brands being offered within the new listings
Sold: Items sold within the lifetime of the multi-quantity listings new listings.
Data Tables
Data is presented in an easy to use tabular format with 3 distinct data view options:
Seller view
Brand view, and
Listings view.
Click on the table headers to sort the data. The data column definitions are:
Seller: The seller’s eBay ID
Listings: Count of listings.
Qty: Quantity of stock available.
Sold: Total quantity sold - which for a new listing could show early signs of demand.
Med Price: Median price is the middle price within the range for that seller or brand.
Med Postage: Median postage is the middle postage price within the range for that seller or brand.
Brands: A snapshot of the brands on offer from the Seller.
Charts
To access the charts, click on the chart icon located at the top right of the data table. Charts visually summarise the data set, including any filters that have been applied. There are charts for:
In the Live Listings Report there the following charts:
Box plot charts for price and postage to show the distribution of listings across the ranges.
Donut charts to visualise comparative values - click on the green text in the chart header to select dimension.
